Paulovich, F. V. ; Moraes,
Marli L. ; Maki, R. ; Oliveira, M. C. F. ; Oliveira JR, O. N. Information
visualization techniques for sensing and biosensing. Analyst, 2011 (to appear).
Abstract: The development of new methods and concepts to visualize massive amounts of data holds the promise
to revolutionize the way scientific results are analyzed, especially when tasks
such as classification and clustering are involved, as in the case of sensing
and biosensing. In this paper we employ a suite of software tools, referred to
as PEx-Sensors, through which projection techniques are
used to analyze electrical impedance spectroscopy data in electronic tongues
and related sensors. The possibility of treating high dimension datasets with PEx-Sensors is advantageous because the whole
impedance vs. frequency curves obtained with various sensing units and for a
variety of samples can be analyzed at once. It will be shown that non-linear
projection techniques such as Sammon's
Mapping or IDMAP provide higher distinction ability than
linear methods for sensor
arrays containing units capable of
molecular recognition, apparently because these techniques are able to capture
the cooperative response owing to specific interactions between the sensing
unit material and the analyte. In addition to allowing for a higher sensitivity
and selectivity, the use of PEx-Sensors permits the identification of the major
contributors for the distinguishing ability of sensing units and of the
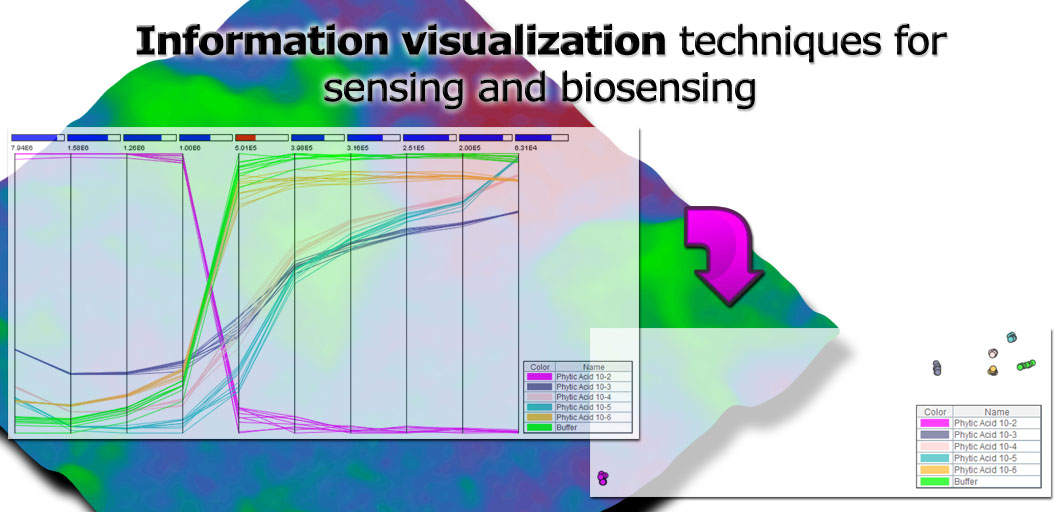
optimized frequency range. The latter will be illustrated with sensing units
made with layer-by-layer (LbL) films to detect phytic acid, whose capacitance
data were visualized with Parallel Coordinates. Significantly, the
implementation of PEx-Sensors was conceived so as to allow for any type
of sensor based on any type of principle of
detection to be used, representing therefore a generic platform for treating
large amounts of data for sensors and biosensors.
You should let Pex-Sensors
to be executed and have the latest Java plugin installed (Site Java).