 |
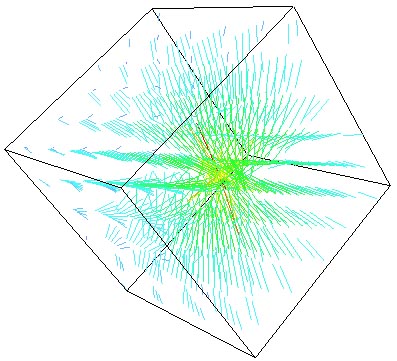
Image generated by the program neuron_vet.
This program visualize the vectors of the magnetic field around the neuron.
It's important to note that this program and the another s shown in this
page allow the user to rotate and scale the images. |
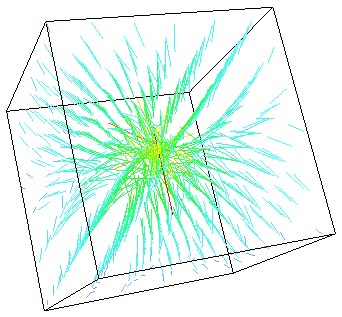 |
Another image generated by the program
neuron_vet. |
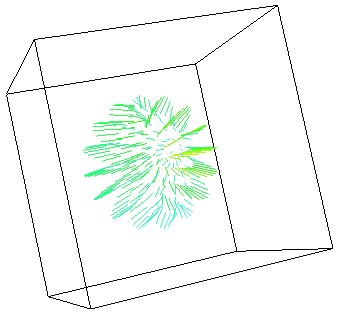 |
Image generated by the program neuron_sph.
This program visualize the vectors of the magnetic field around the neuron
in a different way. It creates a sphere around the neuron and the vectors
that have their origin on that sphere are visualized. The number of the
points on the sphere and the radius of the sphere can be modified (not
interactively, but in the future it will be) |
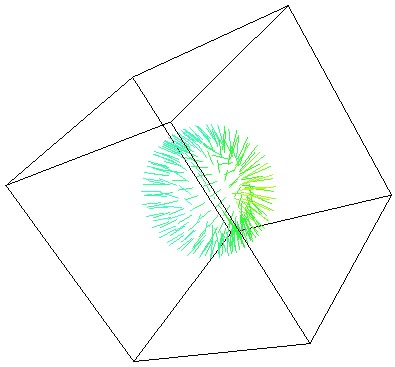 |
Another image generated by the program
neuron_sph. |
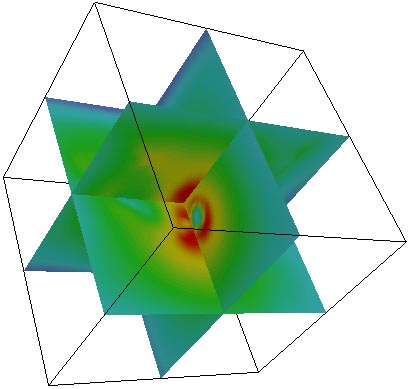 |
Image generated by the program neuron_cut.
This program visualize the intensity of the vectors of the magnetic field
on a plane that cuts the neuron (actually there are three plane, one in
each axis. In the future, it will be only one plane that you can controll
interactivelly) |
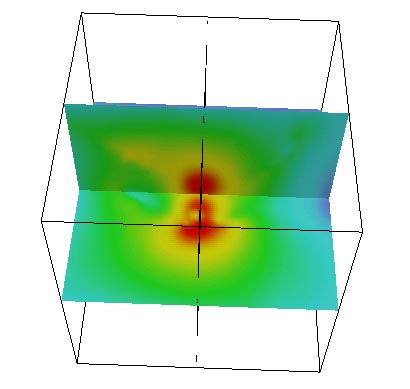 |
Another image generated by the program
neuron_cut. |